
Replay plays a log back through your maps and lights the cell the engine was operating in at each moment — so you can see exactly which parts of a map your driving actually used, and where it spent its time. Open it from the log analyzer (Replay through maps…); a collection must be open, with the maps you want to watch.

A binding ties the log to one map. For each binding you pick the Collection and Map, then connect a log channel to each axis — the X channel → X axis and the Y channel → Y axis — with an optional scale / offset on each for unit conversions. Add, edit and remove bindings as needed; you can bind several maps at once and watch them all light up together. The maps are the named maps in your collection, defined from an A2L or a map pack.
Bind a Value channel as well and the overlay shows the deviation of the logged value from the map’s own value at the operating cell — for example measured AFR against the AFR target. That difference is exactly what you tune against, now shown right on the map where it happened.
Play, Pause and Stop run the log, with a Speed control and a position scrubber. As it plays, the live-cell overlay lights the operating cell(s) on each bound map editor in step with the log — the same overlay mechanism the UI plugins use.
Note — open the bound maps in the map editor so you can see the overlay as the log plays. A cluster of cells that light up a lot is where your tune matters most.
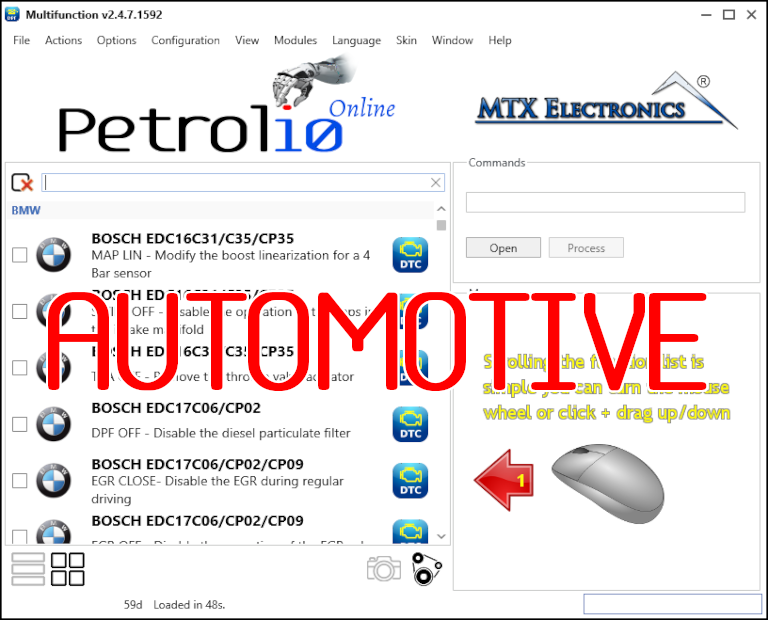
All-in-one application for tuning experts preparing vehicles for track use. Designed for professional workshops, it simplifies the deactivation of non essential components to unlock true performance.
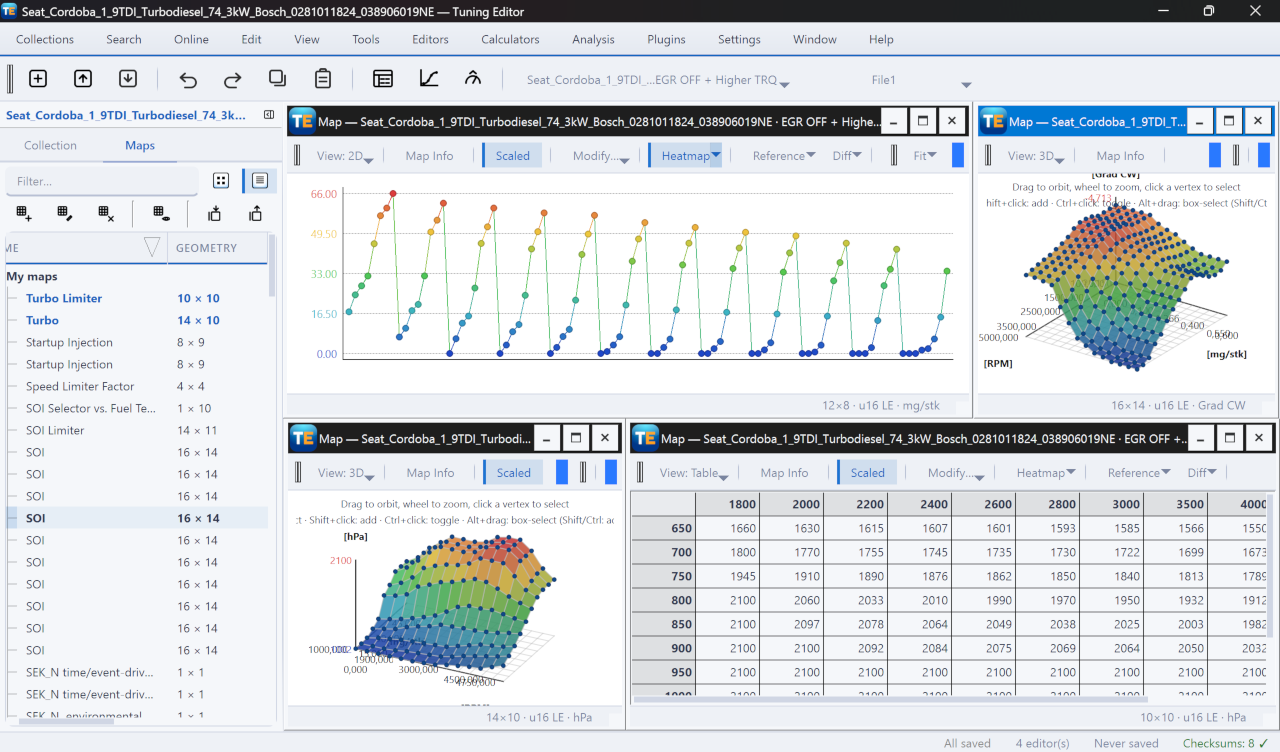
A free, modern Windows software for viewing and editing ECU calibration data - map and hex editors, tuning calculators, and online services.
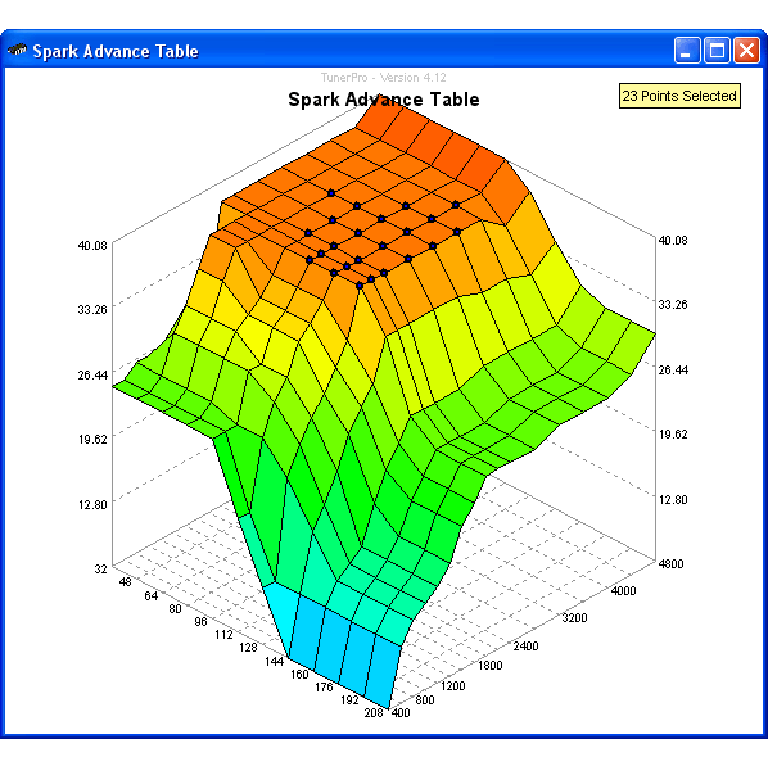
A free collection of checksum correction plugins for TunerPro that ensures safe ECU tuning. Automatically verify and update file checksums for reliable vehicle performance.