
The 2D view shows the map as a line plot — ideal for a one-dimensional curve, or a chosen row or column of a larger map. Switch to it with View › 2D. It shares the top toolbar, the Modify operations and the Reference/Diff comparison with the table view & shared tools; this page covers what is unique to 2D.
A tool strip appears only in this view:
The shared Heatmap button means something specific here: it colours the trace by value rather than shading table cells.
Drag to pan, use the X/Y zoom controls (or the mouse wheel) to zoom, and press Fit to return to a full view of the data.
The plot has its own context menu:
Select a point or a range, then the shared Modify operations apply just as in the table; the Curve submenu adds interpolation along the trace, which is the easiest way to smooth a one-dimensional curve by eye. Out-of-range values are still rejected, and every edit is undoable.
Note — for a two-dimensional map, the 2D view plots one row or column at a time; use the table for the whole grid or the 3D view for the overall shape.
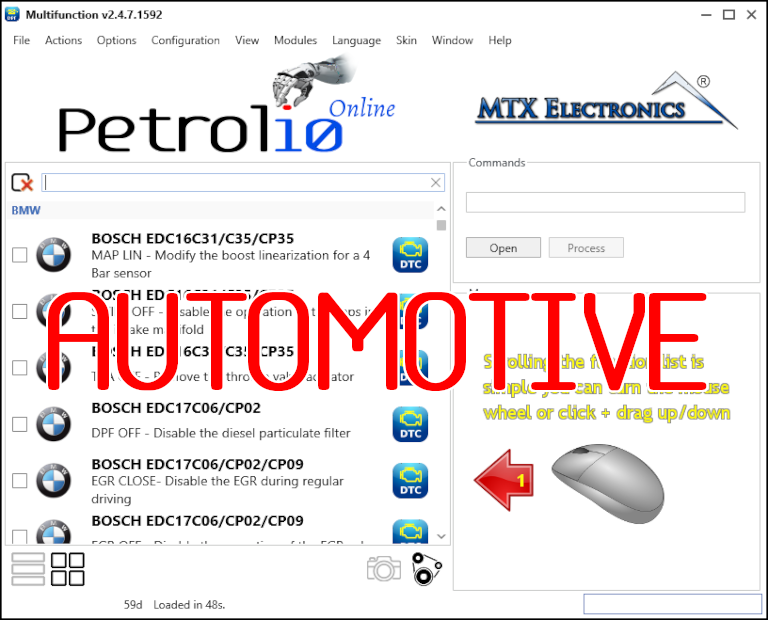
All-in-one application for tuning experts preparing vehicles for track use. Designed for professional workshops, it simplifies the deactivation of non essential components to unlock true performance.
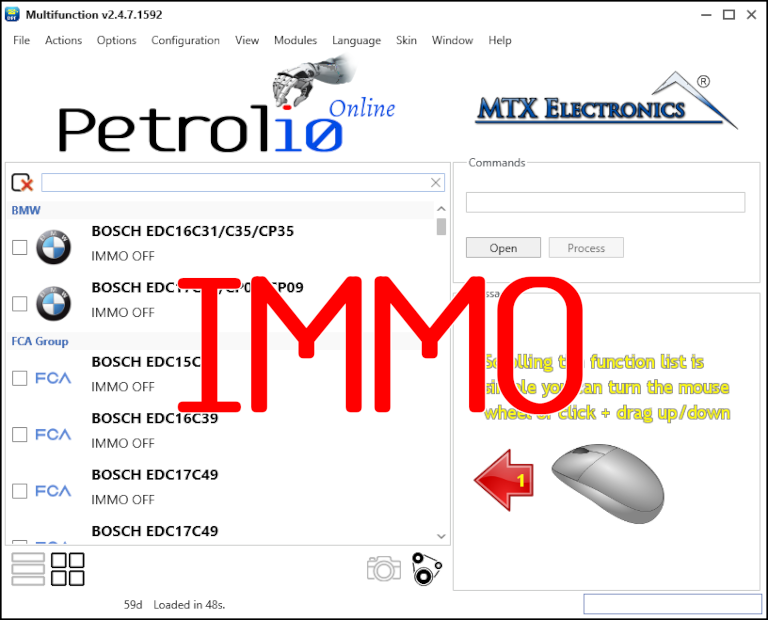
Immobilizer deactivation software for automotive professionals. Disable factory immobilizers directly in the ECU file ideal for engine swaps, track vehicles, and module replacements.
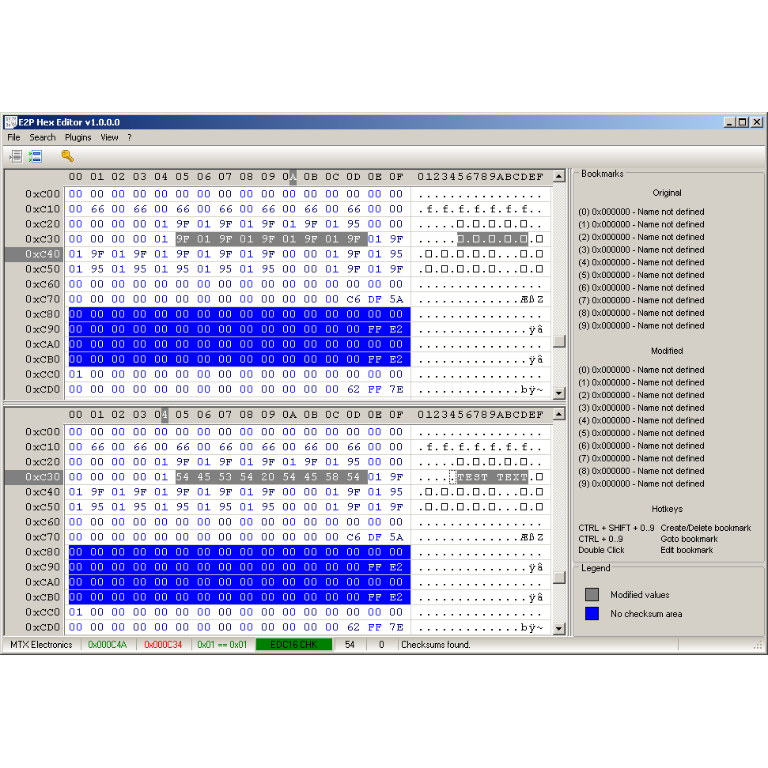
A hex editor built specifically for editing EEPROM data in automotive ECUs. With real-time checksum correction, side-by-side file comparison, and plugin support for automated tasks it's the ultimate tool for professionals.