
Tuning Editor gives you two ways to control colour in the map editor: the Heatmap, which shades table cells by value, and the Editor Colours palette, which sets the colours used for curves, surfaces, grids and so on across every editor. Both apply live to all open views.
In the Table view the Heatmap toolbar button shades each cell according to its value, so hot and cold regions of a map stand out at a glance. Click the button to toggle it on or off; click the ▾ next to it for its settings.

The Heatmap Settings dialog has:
Changes take effect immediately, so the dialog only has a Close button.
The Colours… button on the 2D plot and 3D surface toolbars opens Editor Colours, the application-wide colour palette. Every open editor shares it, so a change here is reflected everywhere at once.

Each row is a colour role with a clickable swatch; click a swatch to pick a new colour. A swatch marked (default) is still using the theme’s colour, and Restore defaults clears your overrides so every role falls back to its theme default. The roles are grouped into a tab per editor:
Tip — set a Manual heatmap range when you want to compare several maps on the same scale; and if a palette experiment goes wrong, Restore defaults puts every colour back.
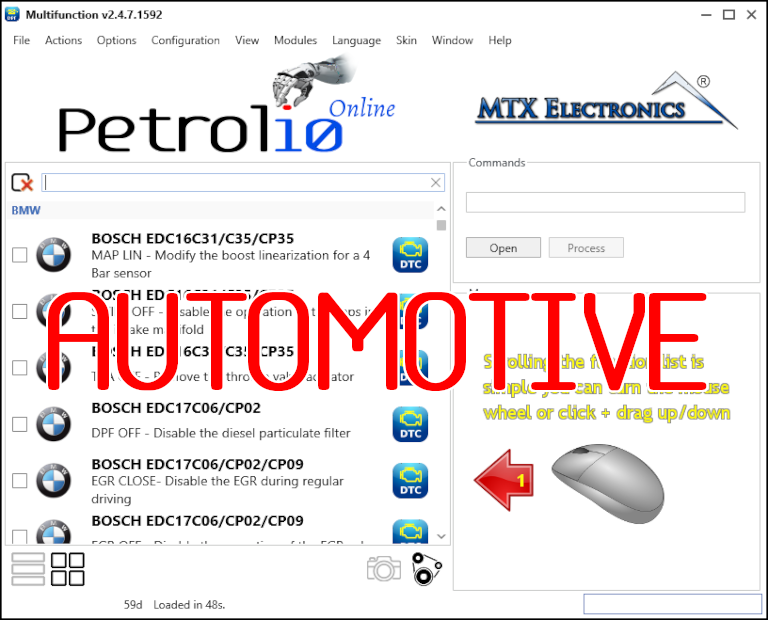
All-in-one application for tuning experts preparing vehicles for track use. Designed for professional workshops, it simplifies the deactivation of non essential components to unlock true performance.
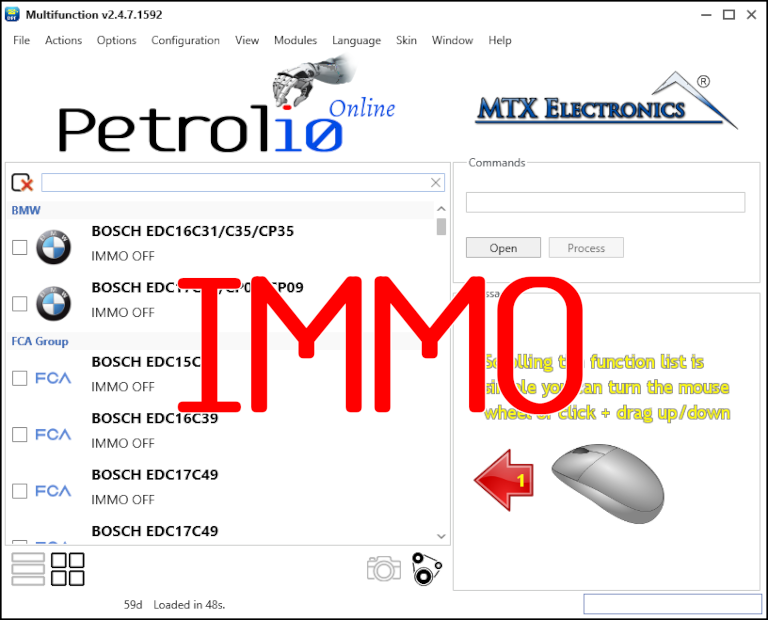
Immobilizer deactivation software for automotive professionals. Disable factory immobilizers directly in the ECU file ideal for engine swaps, track vehicles, and module replacements.
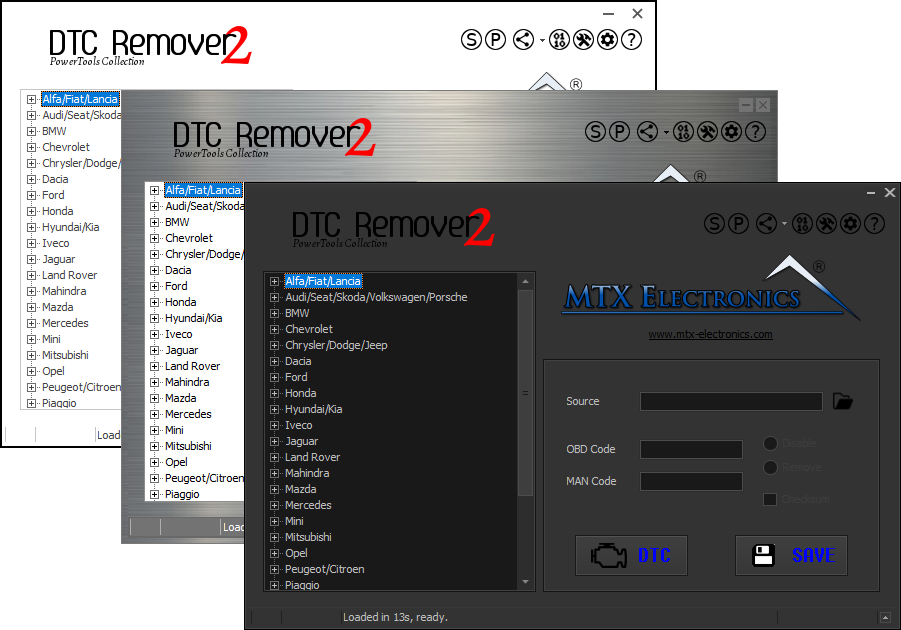
Lets you quickly disable fault codes to turn off the MIL light directly from your ECU file. Available in Standard and PowerTools editions with advanced scripting and online presets to remove faults by component groups.